The research question that we decided to find out more about through the Health and Wellness survey was: How does a student's attitude towards school relate to how safe they feel at school? We thought that this would be a good research question because we assumed that if students did not feel safe at school then they would have a more negative attitude towards school. In order to acquire the necessary information a survey was created and handed out to the school, and the responses that we focused on were: To what extent do you agree with this statement, “ I’m happy to and excited to be at school on most days.” and to what extent do you feel safe from Bullying at school” by comparing the responses to these two questions we believe we are able to figure out if how safe students feel at school affect their attitude towards school.
This is the data gathered by our group for our research question.
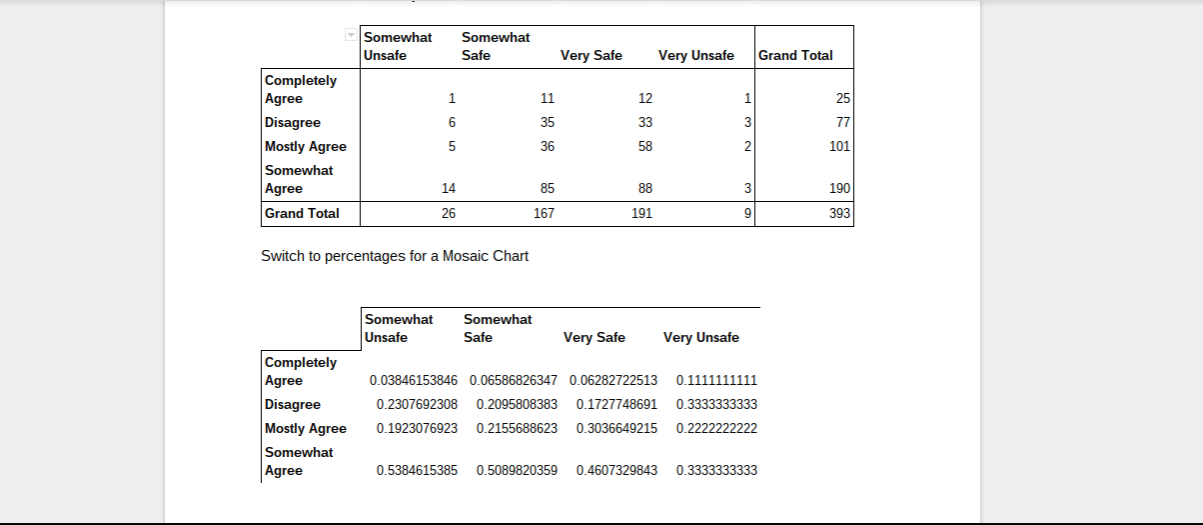
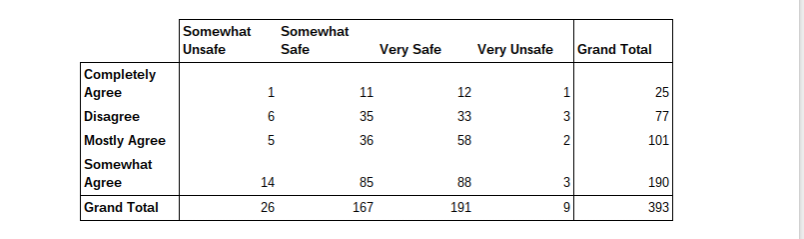
This pivot table shows the number of respondents to the two questions, and is the data that we used to answer our research question and create our graphs. And as you can see it explains a lot of what you see on the Mosaic chart. The amount of respondents who felt “Somewhat Unsafe” and “Somewhat Agree” with the statement is smaller compared to the amount of students who said they felt “Somewhat Safe.” This is what causes the data to look the way it does on the mosaic chart. This pivot table was created by using the above pivot table and switching to percentages in order to create a Mosaic Chart.
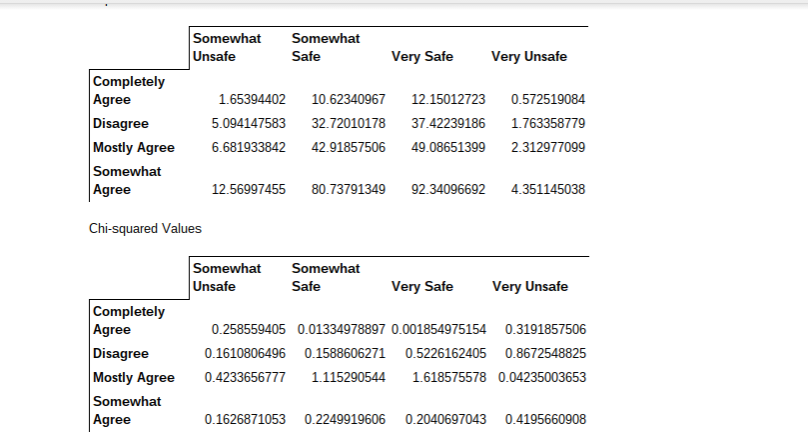
Degrees of Freedom: 9 Chi-Squared Critical Value 6.513659016 Cumulative probability is 0.31 Based on the results of the data we found that the two variables are not dependent. The results of the chi-squared showed that the two variables are not dependent possibly because there is not enough data or because the variables are just not dependent on each other. Although we believe that it does not accurately reflect true responses, because based on logical thinking, if someone did not feel safe in an area then they would not like to be in that area. In this case school, if students did not feel safe at school then they would not be happy or excited to be at school. Granted there are other factors such as friendships that can make someone feel happy, although they do not feel safe. So we believe that maybe if the survey was done again, but with a bigger sample size then maybe the data would reflect more of what we think it should, but it is still possible that it follows this trend and the two variables are genuinely not related.
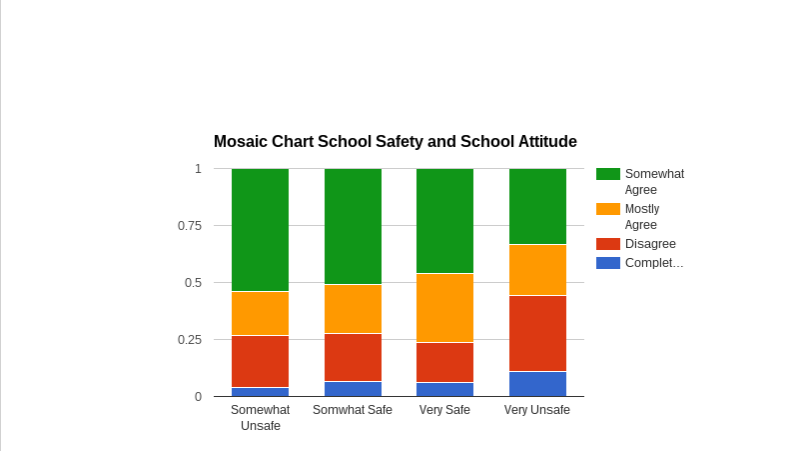
This mosaic chart shows how the responses to the question compare to each other and as you can see that the data is interesting because a lot of the respondents who said they felt Somewhat Unsafe at school also Somewhat agreed with being happy and excited to go to school.
Article This article also talks about bullying and cyberbullying but has a focus on cyberbullying. The article described how many the students felt between those who were bullied and those who were cyberbullied. It showed that those who were cyberbullied feared attack and skipped school more than students who were bullied. So one thing that we can do is use the same research concept but instead focus on cyberbullying and not bullying.